Analytical - Vintage Delays 2
Analysis of the portfolio's transition into delinquency for the corresponding month in percentage terms
For example, if you set the report from January to August, you will see how loans issued in January went into delinquency in each subsequent month until August.
Report interface:
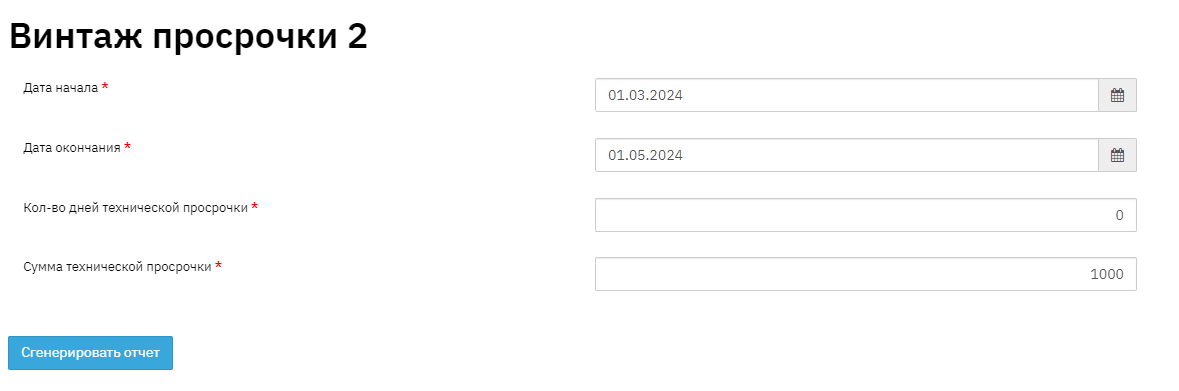
· Fill in the report period;
· Technical delinquency:
Days – in this field, fill in the technical delinquency in days, overdue contracts with the specified number of days of technical delinquency will not be included in the report;
Amount – in this field, fill in the technical delinquency by overdue amount, overdue contracts with the specified amount of technical delinquency will not be included in the report;
Report format is as follows:
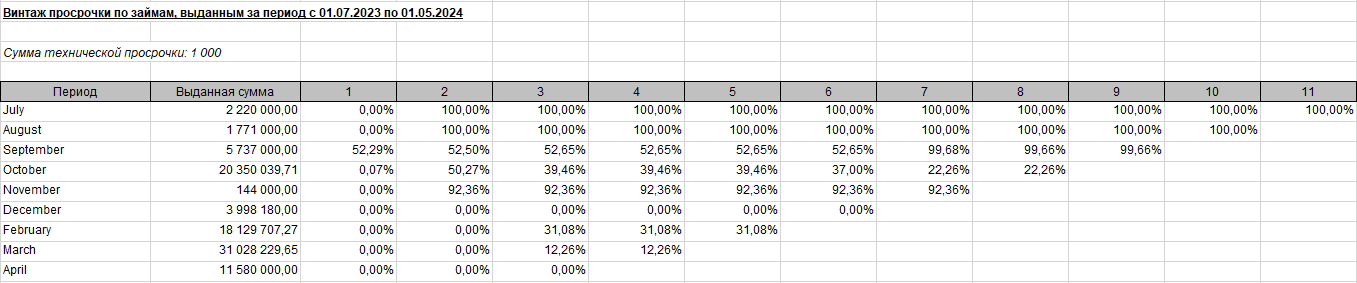
This report displays information from the Vintage Delays report (for a complete understanding of what is included in the report, see the description of the "Vintage Delays" report) in a more accessible summarized format in percentage terms. For example, we can see that loans issued in July dropped by 4.97% by the second month of delinquency, while loans issued in November dropped by 9.56%. This raises the question: what happened? Why did November loans drop more than July loans? This report also offers additional flexibility – for example, to see the truly affected portfolio, you can exclude so-called technical delinquency. It is set before generating the report. For example, 50 rubles is probably not actual delinquency, but simply an additional bank commission that was not accounted for by the client, resulting in slightly less funds being deposited on the repayment date. Or a 3-day delay could also have been caused by a bank transfer delay and excluded from the report. Then the report will only show truly unpaid problem loans.